
Home Buying
How Much House Can I Afford on My Salary?
By Anil Choudhary · Updated September 27, 2026 · Reviewed September 27, 2026 · 14 min read
Quick Answer
There's no single number, it depends on your income, existing debt, down payment, mortgage rate, and location. As a rough starting point, keeping your total monthly housing payment near 28% of your gross income is a common guideline. On a $75,000 salary with a 10% down payment, a 7% rate, and manageable debt, that points to a home in the neighborhood of $220,000-$230,000. Use the assumptions below to find your own number.
Key Takeaways
- •Salary is only one input. Debt, down payment, mortgage rate, taxes, insurance, and PMI all move the final number, sometimes by tens of thousands of dollars.
- •A 28% front-end / 36% back-end debt-to-income guideline is a common starting point, but it isn't a hard rule and some lenders qualify buyers well above it.
- •Every example in this guide assumes a 10% down payment and a 7% mortgage rate unless stated otherwise, both change your number quickly if yours are different.
- •What a lender approves and what fits comfortably in your monthly budget are two different numbers, and it's worth knowing both before you shop.
- •Our free House Affordability Calculator lets you plug in your own income, debt, and down payment instead of relying on the examples here.
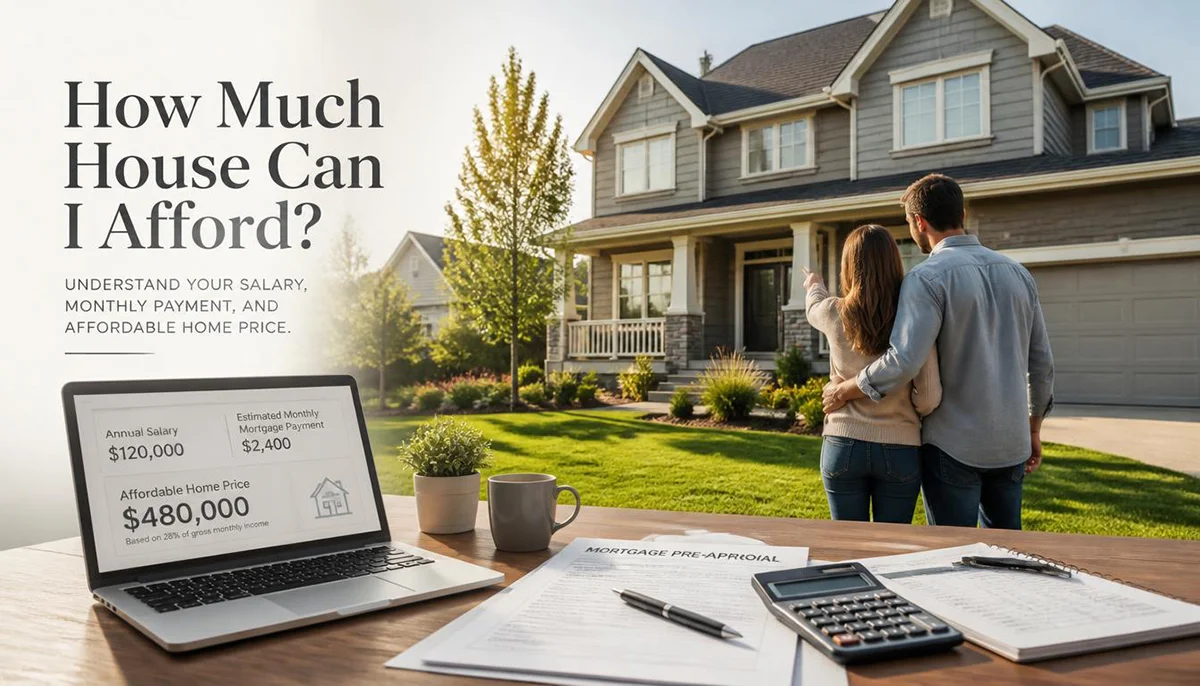
Typing your salary into a search bar and expecting one clean answer is understandable, everyone wants a number to work with. But home affordability doesn't work off salary alone. Two people earning exactly $75,000 a year can qualify for very different homes once you factor in their debt, their down payment, their credit profile, and the mortgage rate they're offered.
This guide walks through the real inputs that determine how much house fits your budget, with worked examples at six common salary levels, so you can see roughly where you land and understand which levers actually move the number.
Calculator: How Much House Can I Afford?
Enter your own numbers below to get a personalized estimate. This uses the same 28% front-end / 36% back-end debt-to-income guideline explained later in this article, plus average property tax, insurance, and PMI assumptions that you can adjust.
Estimated Affordable Home Price
$0
PMI is assumed at 0.75% of the loan per year and only applies below 20% down; it's automatically removed once your down payment reaches 20%. This tool gives an estimate for planning purposes, it isn't a loan pre-approval or offer of credit.
Why Salary Alone Doesn't Answer the Question
Your salary sets the ceiling on what's possible, but several other factors decide where inside that ceiling your actual number falls:
- Gross monthly income, your pay before taxes and deductions, is the base lenders calculate ratios against.
- Existing monthly debt, car payments, student loans, minimum credit card payments, competes with housing for the same slice of your income.
- Down payment reduces how much you need to borrow, which lowers your monthly principal and interest.
- Mortgage interest rate changes how much of each payment goes to interest versus principal, which changes how large a loan the same payment can support.
- Loan term, usually 30 years or 15 years, changes your monthly payment and total interest paid.
- Property taxes vary by county and can add hundreds of dollars a month in some areas.
- Homeowners insurance depends on your home's value, location, and local risk factors like flood or wildfire exposure.
- PMI (private mortgage insurance) typically applies on conventional loans with less than 20% down.
- HOA fees, if your home has them, are a fixed monthly cost on top of the mortgage.
- Credit profile affects the interest rate you're offered, which changes your buying power more than most people expect.
Change any one of these and the "how much house can I afford" answer moves, sometimes significantly. That's why this guide leans on examples and ranges rather than a single formula.
Understanding Debt-to-Income Ratio (DTI)
Debt-to-income ratio, or DTI, is simply your monthly debt payments divided by your gross monthly income, expressed as a percentage. Lenders use it to judge how much additional debt (your mortgage) you can reasonably take on.
Front-End DTI
Front-end DTI looks only at your proposed housing payment, principal, interest, taxes, insurance, PMI, and HOA, divided by gross monthly income. A common guideline caps this around 28%, though it varies by lender and loan program.
Back-End DTI
Back-end DTI adds your housing payment to all other monthly debt, car loans, student loans, credit card minimums, then divides by gross monthly income. Many conventional lenders look for a back-end DTI at or below 36%, though some loan programs, particularly FHA loans, allow back-end ratios well above 43% for well-qualified borrowers.
Lender Qualification vs. Comfortable Affordability
Here's the distinction that matters most: a lender's DTI limits describe what you can qualify for, not necessarily what you'll be comfortable paying every month. Lenders don't know about your savings goals, your childcare costs, or how much you want left over for emergencies. Plenty of buyers qualify for more house than they'd actually choose to pay for once they look at their full monthly picture.
Affordability by Salary: The Assumptions Behind Every Example
Every example below uses the same baseline assumptions, so the numbers are comparable to each other. Change any of these inputs for your own situation and your real number will differ.
| Assumption | Value Used |
|---|---|
| Down payment | 10% of home price |
| Mortgage rate | 7.0%, 30-year fixed |
| Housing payment target | ≈28% of gross monthly income |
| Property tax | ≈1.1% of home value per year (national average range) |
| Homeowners insurance | ≈0.35% of home value per year (national average range) |
| PMI | ≈0.75% of loan amount per year (applies under 20% down) |
| HOA fees | $0 (add separately if your target home has one) |
| Other monthly debt | Minimal, see the debt section below for how this changes things |
Mortgage rate reflects national averages reported by Freddie Mac and major mortgage data providers in late September 2026. Property tax and insurance rates vary widely by state and county, use your own local numbers where you can. These figures are estimates for illustration, not a quote or lending decision.
How Much House Can I Afford: Salary Comparison Table
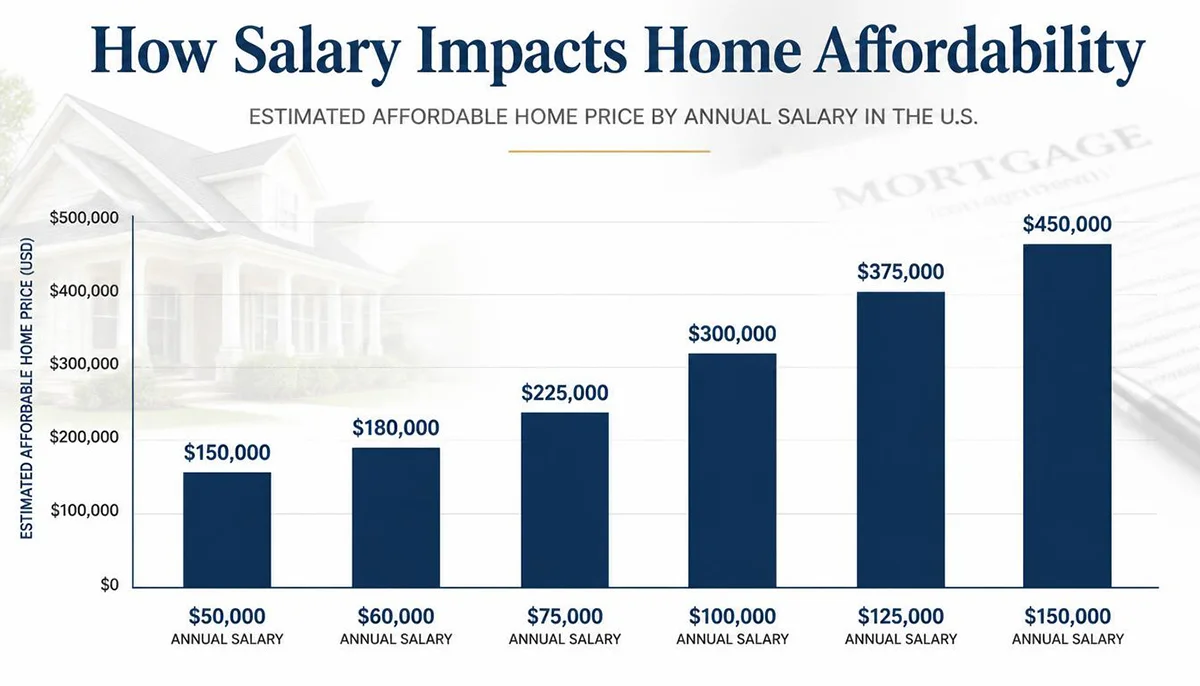
Here's how the numbers work out across six common salary levels, using the assumptions above.
| Annual Salary | Gross Monthly Income | Est. Affordable Home Price | Est. Total Monthly Payment |
|---|---|---|---|
| $50,000 | $4,167 | ≈$150,000 | ≈$1,170 |
| $60,000 | $5,000 | ≈$180,000 | ≈$1,400 |
| $75,000 | $6,250 | ≈$225,000 | ≈$1,750 |
| $100,000 | $8,333 | ≈$300,000 | ≈$2,330 |
| $125,000 | $10,417 | ≈$376,000 | ≈$2,920 |
| $150,000 | $12,500 | ≈$451,000 | ≈$3,500 |
Based on a 10% down payment, a 7% 30-year fixed rate, minimal other debt, and average property tax and insurance assumptions. Your actual number will vary with your debt, credit profile, location, and the rate a lender actually offers you.
How Much House Can I Afford With a $50,000 Salary?
At $50,000 a year, gross monthly income comes to about $4,167. Keeping the total housing payment near 28% of that puts the target payment around $1,170 a month. With a 10% down payment and a 7% rate, that lines up with a home price in the ballpark of $150,000, once property tax, insurance, and PMI are included alongside principal and interest.
At this income level, existing debt matters a lot. A car payment or a couple hundred dollars in student loan payments can meaningfully shrink the room left for a mortgage payment under a lender's back-end DTI limit, more so than at higher income levels where there's more cushion.
How Much House Can I Afford With a $60,000 Salary?
A $60,000 salary works out to roughly $5,000 a month before taxes. A 28% housing-payment target lands near $1,400 a month, which, under the same 10% down and 7% rate assumptions, supports a home price around $180,000. Moving to a 5% down payment would lower the upfront cash needed but add PMI cost and a slightly higher loan amount, moving to 20% down removes PMI but requires a larger down payment.
How Much House Can I Afford With a $75,000 Salary?
At $75,000 a year, monthly gross income is about $6,250. A 28% front-end target puts the housing payment near $1,750 a month, which supports a home price around $225,000-$230,000 under this guide's baseline assumptions.
This is a good salary level to see how debt changes the picture. The table below compares three debt scenarios for the same $75,000 salary.
| Existing Monthly Debt | Binding Limit | Est. Affordable Home Price |
|---|---|---|
| $0 | 28% front-end | ≈$225,000 |
| $400 | 28% front-end | ≈$225,000 |
| $800 | 36% back-end | ≈$187,000 |
At $75,000 salary and 7% rate, $400 in existing debt still fits comfortably inside the 36% back-end limit. Push debt to $800 a month and the back-end ratio becomes the tighter constraint, pulling the affordable price down by roughly $38,000.
How Much House Can I Afford With a $100,000 Salary?
A $100,000 salary comes to about $8,333 a month before taxes. At a 28% housing-payment target, that's roughly $2,330 a month, which supports a home price around $300,000 under the baseline assumptions used throughout this guide. Some buyers at this income level qualify for considerably more from a lender, particularly if they carry little other debt, but qualifying for more doesn't automatically mean it fits comfortably in a monthly budget once savings goals and other expenses are factored in.
How Much House Can I Afford With a $125,000 Salary?
At $125,000 a year, gross monthly income is about $10,417. A 28% target payment comes to roughly $2,920 a month, supporting a home price near $376,000 under this guide's assumptions. At this income range, many households have more flexibility to choose a lower payment than the maximum, prioritizing a bigger down payment, a shorter loan term, or simply more monthly breathing room.
How Much House Can I Afford With a $150,000 Salary?
A $150,000 salary works out to about $12,500 a month. A 28% target payment lands near $3,500 a month, which lines up with a home price around $451,000 under the same baseline assumptions. As with the $125,000 example, this is often a point where a household can comfortably choose a payment below their maximum qualifying amount without sacrificing the home they actually want.
How a Down Payment Changes Affordability
A bigger down payment does two things at once: it shrinks the amount you need to borrow, and once you reach 20% down on a conventional loan, it removes PMI from the payment entirely. Here's how that plays out for a $75,000 salary with the same $1,750 target monthly payment, holding the rate at 7%.
| Down Payment | Down Payment Amount | Est. Home Price | PMI Required? |
|---|---|---|---|
| 5% | ≈$10,800 | ≈$215,000 | Yes |
| 10% | ≈$22,600 | ≈$226,000 | Yes |
| 20% | ≈$53,600 | ≈$268,000 | No |
For the same monthly payment, a 20% down payment supports a noticeably higher home price than 5% or 10% down, mainly because it eliminates the PMI cost that would otherwise eat into the budget.
What is PMI? Private mortgage insurance protects the lender, not you, if you default on a conventional loan with less than 20% down. It typically costs somewhere between roughly 0.3% and 1.5% of the loan amount per year, depending on your credit score and down payment size, and it's usually removable once you reach 20% equity in the home.
How Mortgage Rates Affect Purchasing Power
The interest rate on your mortgage changes your monthly payment more than most first-time buyers expect. Here's the monthly principal and interest on a fixed $300,000 loan at three different rates over a 30-year term.
| Interest Rate | Monthly Principal & Interest on $300,000 |
|---|---|
| 6.0% | $1,799 |
| 7.0% | $1,996 |
| 8.0% | $2,201 |
A 2-percentage-point swing on the same $300,000 loan changes the monthly principal and interest payment by roughly $400, which is why the rate you're offered matters just as much as your salary. As of late September 2026, average 30-year fixed mortgage rates have been trending in the high-6% to low-7% range according to Freddie Mac's weekly survey, check current rates before running your own numbers.
Costs Buyers Often Forget
The sticker price and the mortgage payment are only part of the real monthly cost of owning a home. These often get underestimated or left out of a first-time buyer's budget entirely:
- Property taxes, billed annually or semi-annually but usually collected monthly through an escrow account.
- Homeowners insurance, required by lenders and increasingly expensive in areas with higher flood, wildfire, or storm risk.
- PMI, on conventional loans with less than 20% down, or mortgage insurance premiums on FHA loans.
- HOA fees, common in condos, townhomes, and many newer subdivisions, and not always included in online listing estimates.
- Maintenance and repairs, a widely cited rule of thumb is budgeting 1-2% of the home's value per year, though older homes often run higher.
- Closing costs, typically 2-5% of the loan amount, covering lender fees, title insurance, appraisal, and other one-time costs paid at closing.
Skipping any of these when budgeting is one of the most common reasons a mortgage payment that looked comfortable on paper feels tight once the keys are in hand.
How Much Should My Monthly Housing Payment Be?
The 28% front-end guideline used throughout this article is a reasonable starting point, but it isn't the only way to think about it. Some financial planners suggest staying closer to 25% for households prioritizing aggressive saving, while some lenders qualify buyers with front-end ratios above 30%, particularly on FHA loans or in high-cost markets. There's no single correct percentage for every household, only the number that still leaves room for your other financial goals.
Lender Approval vs. Real Affordability vs. Comfortable Budget
It helps to think of three separate numbers, not one:
- What a lender may approve. Based on DTI limits, credit score, and loan program rules, this is often the highest of the three numbers.
- What you can realistically afford. Factoring in maintenance, closing costs, and the full monthly cost of ownership beyond just the mortgage payment.
- What fits comfortably in your budget. After savings goals, retirement contributions, childcare, and everyday expenses are accounted for.
The gap between these three numbers can be significant. Approaching a home search with your comfortable number in mind, rather than your maximum approval amount, tends to lead to less financial stress after move-in.
Step-by-Step: Calculate Your Own Affordability
Here's a practical walkthrough you can run with your own numbers.
| Step | What To Do |
|---|---|
| 1 | Calculate your gross monthly income (annual salary ÷ 12). |
| 2 | Add up your existing monthly debt payments (car, student loans, credit card minimums). |
| 3 | Estimate an affordable housing payment, a common starting point is 25-28% of gross monthly income. |
| 4 | Subtract estimated property tax, insurance, PMI, and HOA from that housing payment to find the room left for principal and interest. |
| 5 | Use a mortgage calculator to back into the loan amount that principal-and-interest figure supports at current rates. |
| 6 | Add your planned down payment to the loan amount to estimate your affordable home price. |
| 7 | Compare the result against your actual monthly budget, savings goals, and comfort level, not just the lender's maximum. |
Run Your Own Numbers
Every number in this guide is an illustration built on one set of assumptions. Your income, debt, credit profile, and target location will change the real answer. Use the calculator above to plug in your own income, debt, down payment, and rate, or visit our full House Affordability Calculator for more control over the assumptions.
Pair it with the Down Payment Calculator to see how different down payment amounts change your monthly payment, and the Closing Cost Calculator so the cash you need at closing doesn't catch you off guard.
This article is for general information and isn't financial or lending advice. Every dollar figure above is an illustrative estimate based on the stated assumptions, actual affordability depends on your lender, credit profile, location, debt, interest rate, taxes, insurance, and down payment. Mortgage rate figures reflect national averages reported in late September 2026 and change frequently, check current rates before making any decisions. Speak with a licensed mortgage lender for an actual pre-approval.
Editorial Policy
This article is reviewed for factual accuracy and updated using publicly available Freddie Mac, Consumer Financial Protection Bureau, and industry mortgage-rate data.
Last reviewed: September 27, 2026 · Next scheduled review: March 2027